Sept 24, 2023
XYZ Data Analysis

It is necessary to understand the demographical composition of the respondents. Among the demographical variable include age, gender, educational income level, and the associated monthly incomes of the respondents. A crosstab is a vital tool that dissects on these basic variables to understand the prevailing distributions. Therefore, the first step is to understand how our respondents are distributed along these categories.
A Cross Tab Analysis on Gender and Age as the rows and Education level and monthly salaries as columns has the following outputs.
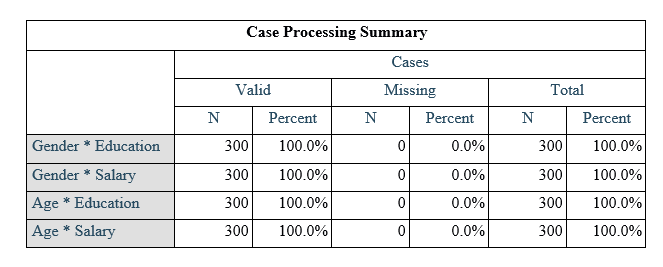
From the above summary, the total number of respondents, N = 300. There were no missing variables under Gender, Age, Education, and salary, hence the 100% response. Gender*Education
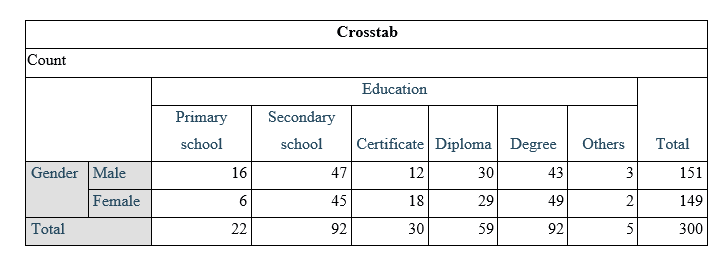
Out of the 300 respondents, a total of 151 (50.0333%) were females while149 (49.6667%) were males. statistically, there is no significant difference between the two gender lines. in terms of education, a total of 22 respondents had studied up to primary level. The number forms 0.0733% of the total respondents. Out of this category, 16 are males while 6 are males. A total of 92 reached the secondary school as their highest education level. 47 of this category are males while 45 are females. 30 of the total respondents have studied up to certificate level. This forms 0.1%. 59 of those included in the study had attained their Diplomas. 30 of the Diploma holders are males while 29 were females. 92 had attained their college degrees. Out of these, 43 were males while 49 were females. Finally, 5 respondents had attained other academic levels, for which 3 were males while 2 were females.
(a) Pearson R (Correlation)
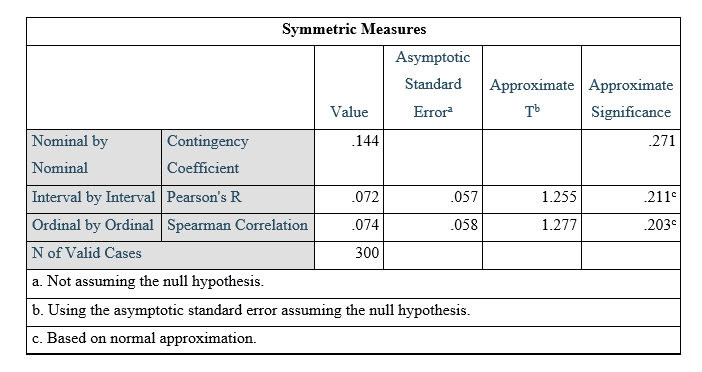
The Pearson correlation between gender and education is 0.72. This implies there exists a strong positive correlation between the two variables.
(b) Gender * Salary
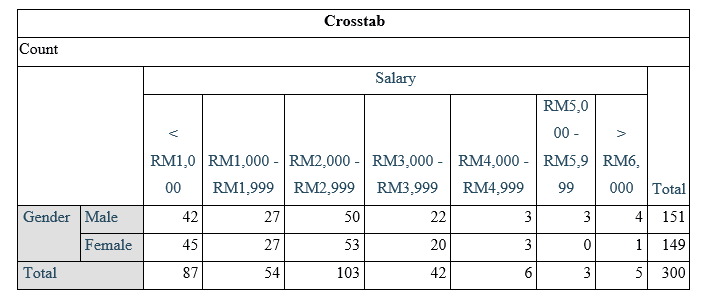
Additionally, a total of 87 of the respondents earn below RM 1000, with 42 being males and 45 females. Also 54 of those included in the study earn between 1000 to1999. Out of this number 27 are males while 27 are females. 103 fall under 2000-2999. This number includes 50 male respondents and 53 female respondents. 42 earn between 3000-3999. While 6, 3, and 5 of the remaining respondents earn between 4000-4999, 5000-5999, and 6000 and above respectively. Out of the 5 people earning RM 6000 above, only one is a female while 4 are all males. Therefore, earning across the two gender lines are statistically equal except for the highest salaries, where males are likely to earn more compared to females.
(c) Age * Education
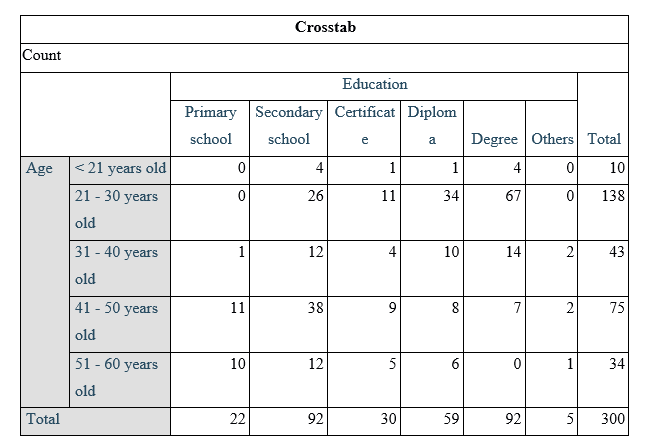
Among the participants, majority with University degree as their highest educational are 92. In terms of their age distribution, 4 are below the age of 21. Majority of this group are falling between the ages of 21 to 30 years. Only 7 of degree holders are between the age of 41 and 50 years.
(d) Age * Salary
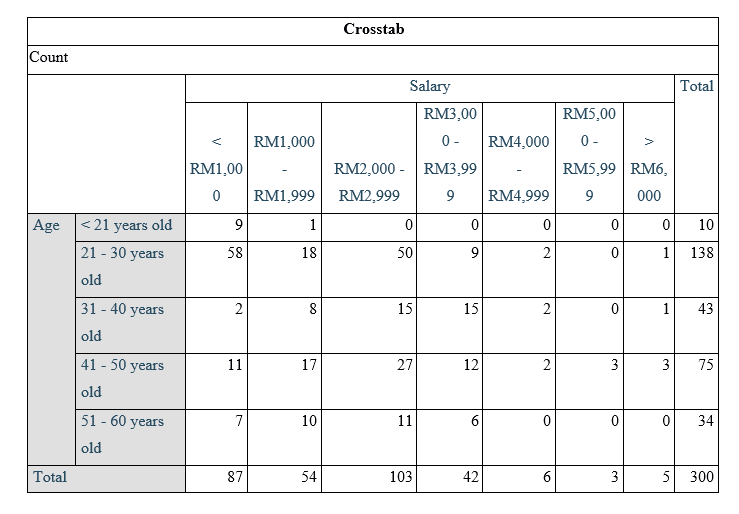
The above table summarizes the level of earnings in relation to the ages of the respondents. From the table, it is evident that majority earn between RM 2000-RM 2999, with a total of 103. This is followed by 87 people earning below RM 1000.
Understanding The Customers’ Reactions On The Status Of XYZ Business
Customer perception of a business’ operation is a vital statistic. Therefore, every business, including, XYZ should keep records on their organization’s customer reactions to their employee’s operations. some of these key variables included in the study are responsiveness of the employee to the customer demands (Responsive 11), confidence of the customers on XYZ employees’ code of conduct (Assurance 14), and the rate how these employees are ready to offer individual services to customers where necessary. Additionally, it is necessary to find out if there us tangible evidence to suggest that demographical dynamics such as gender and race has an influence on the customers’ point of view. Below are the summaries.
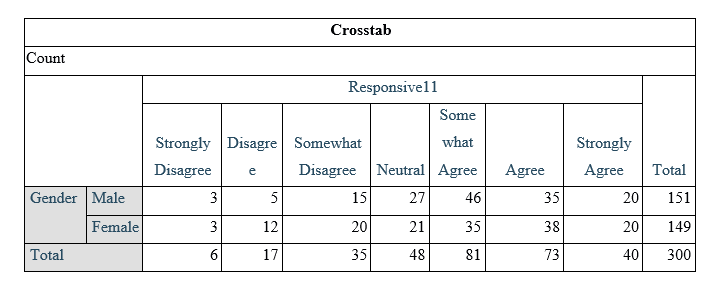
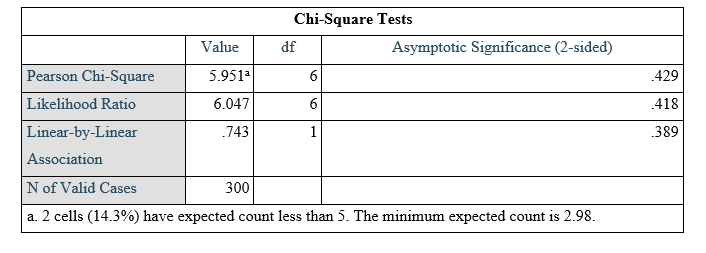
Gender * Responsive 11
Comparatively, majority of the respondents agree that XYZ employees are quick to respond to their needs. However, 87 of those questioned somewhat agree to this claim. 6 of the respondents strongly disagree to this statement. Out of the 6, 3 are male and 3 are females. From the below output, there is no significant difference across the gender line. The chi-square value of independence between the two variables is 0.429. Compared to the value of alpha, 0.05, we conclude that statistically, one’s opinion on the XYZ responsiveness rate is depended on their gender.
Summary Statistics on Tangibles, Empathy, Satisfaction and Value
Descriptives
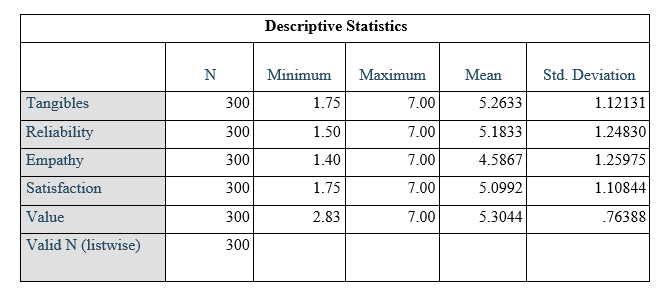
From the above output, the average tangles value is 5.2622, with a standard deviation of 1.1213. The minimum tangible value awarded is 1.75 while the highest is 7. The other parameter is reliability of the XYZ employees. Factors constituting reliability include promises, performing perfectly performing a task for the first time, and insisting on error-free records. Based in these factors, the minimum reliability value is 1.50 while the highest value is 7. The mean reliability rating is 5.1833 with a standard deviation of 1.2483.
Also, necessary to capture is the employee’s level of empathy. This is measured on the basis of various factors. These include provision of individual attention, equal and conducive operation hours among all their customers, and finally, XYZ Company clearly understand the needs of their employees. The minimum empathy value according to the study is 1.40 while the maximum is 7. The mean XYZ empathy rating is 4.5867 with a standard deviation of 0.7639. All these factors determine the levels of customer satisfaction. Every enterprise’s goal is to keep high customer retention rate whole winning new ones. The least satisfied customer awarded XYZ Company 1.75 while the most satisfied customer awarded 7. The mean customer satisfaction rate for the organization is 5.0992, with a standard deviation of 1.10844.
Correlation Analysis
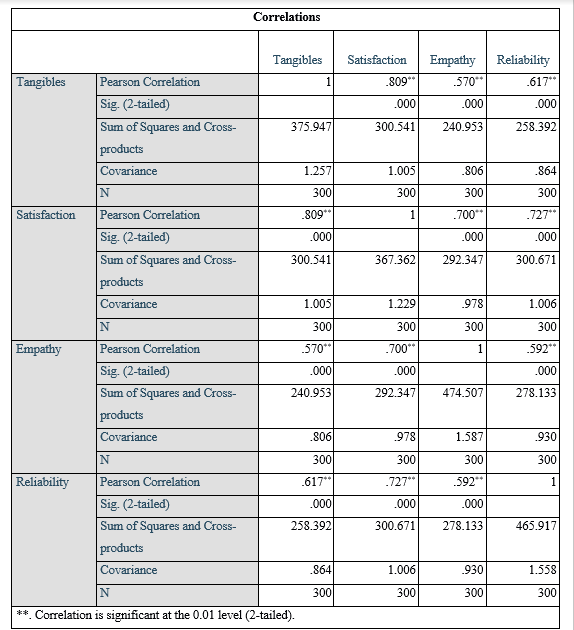
The above analysis showcases the Pearson pairwise correlation among the four variables. There is a strong positive correlation between Tangibles and customer satisfaction level. The Pearson correlation value is 0.809, with 0.000 p-values. This shows a strong positive correlation. Also, there is a moderate correlation between the Tangibles and the XYZ empathy ratings. The value is 0.57 a corresponding p-value of 0.000. This implies a strong positive correlation. Also, the correlation between Tangibles and XYZ’s reliable is 0.617. There is a strong positive correlation of 7 between the organization’s empathy and their customers’ satisfaction level. , the correlation between the organization’s reliability and customer satisfaction level stands at 7.27. therefore from the above information, for the organization to retain more of its customers, the organization need to encourage their employees to be more reliable, empathetic, and invest more on their aesthetic appearances. The other critical statistic to consider is the covariance between the variables. For instance the covariance between Tangibles and reliability is 0.864.
Linear Regression Analysis
This form of analysis quantifies net effect of an independent variable on the dependent variable. There are basic assumptions that are made before proceeding with a linear regression model. First, variables involved should be linearly related. Secondly, the random error terms are normally distributed with a mean value of 0 and variance sigma squared. The dependent and independent variables are linearly related. For a case of the multiple linear regression models, the independent variable should have 0 correlations. Finally, homoscedasticity should be met.
(a) A Simple Linear Regression Analysis of Customer satisfac¬tion against XYZ reliability
A simple linear regression model is of the form:
y=β0+ β1X+e where:
Y is the predicted or independent variable
X is the predictor variableβ0 is intercept value
β1 is the gradient
e is the random error term
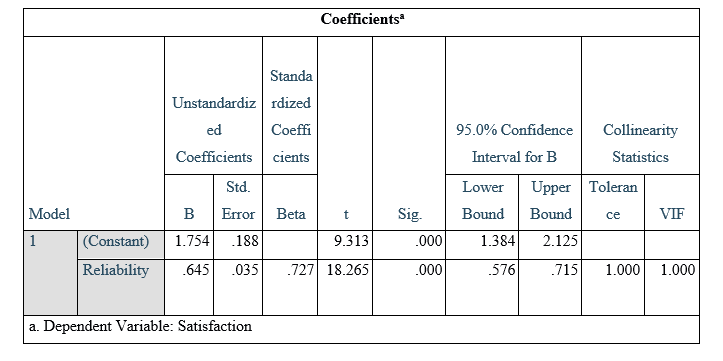
In running a simple linear regression model of Satisfaction against the organization’s reliability level, the model has the following coefficients.
The model has an intercept value β0 of 1.754 and a slope of β1 of 0.645.
Interpretation
β0 = 1.754 implies that at reliability 0, the level of customer satisfaction at XYZ enterprise is at 1.754.
β1 = 0.645, implies that a unit increase in the value of reliability ratings results into an average 0.645 increase in the level of customer satisfaction.
Hence the model is as follows:
Satisfaction (Y) = 1.754 + 0.645 (Reliability) + e.
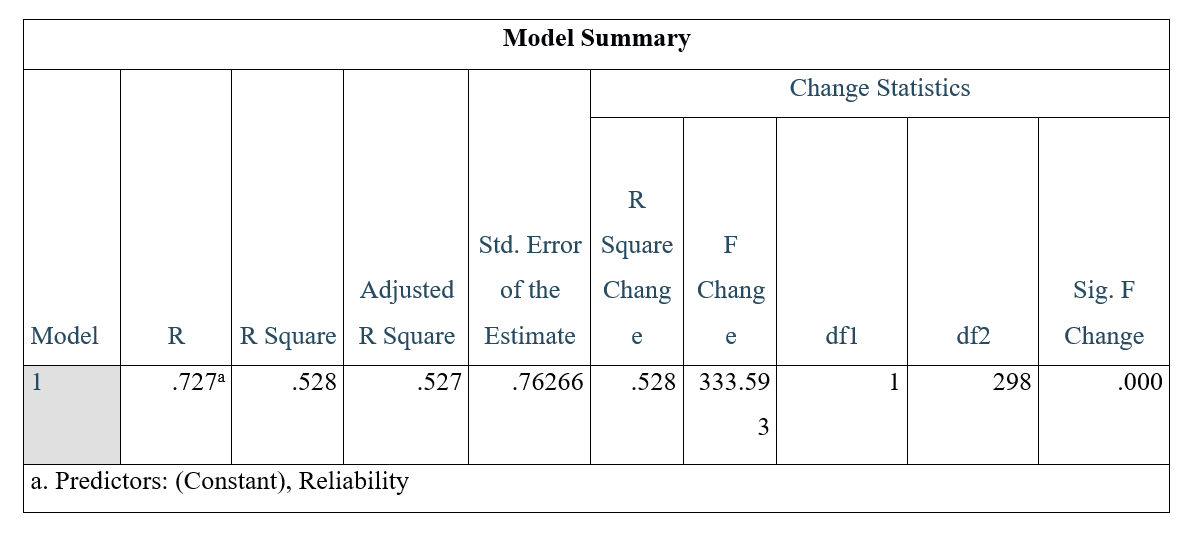
One of the important statistic from the linear regression model is R. the amount of variability in the dependent variable explained by the model. The value of R for model is 0.727. This implies that 72.7% of the variability in customer satisfaction is explained by reliability. The corresponding p-value is 0.000. This implies that the model is appropriate at alpha 0.05.
The ANOVA Table
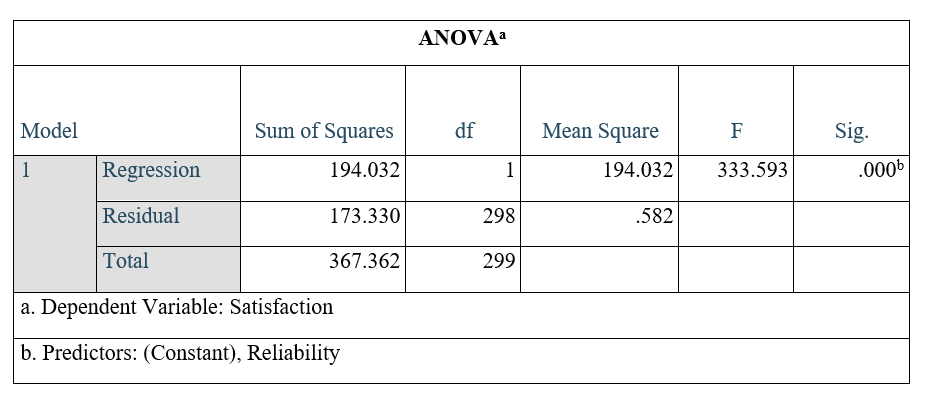
From the ANOVA table, the Regression Sum of Squares is 194.032. the corresponding Residual Sum of Squares is 173. 330 with 298 degrees of freedom. the F value from this analysis is 333.593. from the p- value, it is correct to conclude that the model is significant.
3 Comments

Elizabeth Ouma01 Oct 2023 at 12:00pm
I find this analysis highly informative, particularly in highlighting the strong correlations between tangibles, empathy, and reliability with customer satisfaction in XYZ Company. The clear presentation of statistical data, including mean values, standard deviations, and Pearson correlation coefficients, provides valuable insights into what drives customer satisfaction. This makes it a useful resource for understanding the impact of different business practices on customer experiences. Thank you Erick!

Erick Otieno02 Oct 2023 at 2:00pm
You are most welcome.

Faith Munene 20 Dec 2023 at 6:00pm
From the comprehensive statistical analysis of XYZ Company, including the relationships between gender, age, education, salary, and factors like tangibles, reliability, empathy, and customer satisfaction, my relative follow question as a manager would be: "How can my Company leverage the insights from the linear regression model and the Pearson correlation analysis to develop targeted strategies for improving customer satisfaction, especially focusing on the aspects of reliability and tangibles?"
Erick Otieno23 Dec 2023 at 4:00pm
Thank you Faith. In response to your question on how your company can use the insights from the linear regression model and Pearson correlation analysis to enhance customer satisfaction, several targeted strategies can be adopted. First, the strong correlation between reliability and customer satisfaction suggests a need for focused improvement in this area. You can implement comprehensive training programs aimed at improving the reliability of your services. This might include training staff to ensure accuracy, consistency, and timeliness in their tasks.
Additionally, the significant correlation between tangibles and customer satisfaction highlights the importance of the physical aspects of service delivery. You can invest in upgrading your facilities, improving the quality of your physical resources, and ensuring that the tangible elements of your services are appealing and modern.
Furthermore, the demographic analysis of gender, age, and education provides an opportunity to tailor services to different customer segments. For example, creating targeted marketing campaigns or customized service offerings based on these demographic insights could lead to higher satisfaction levels among diverse customer groups.
Finally, continuous feedback mechanisms should be established to monitor the effectiveness of these strategies. Customer surveys, feedback forms, and other tools can be utilized to gather ongoing input from customers, ensuring that your company remains aligned with its needs and expectations.
By focusing on these areas, your can leverage your data-driven insights to develop a more satisfying and engaging customer experience, ultimately leading to higher customer retention and business success. Hope this helps.
Faith Munene23 Dec 2023 at 6:00pm
Thank you so Much! This is very enlightening.
Erick Otieno 23 Dec 2023 at 9:00pm
Much Welcome.
Leave a comment
Erick Otieno
CEO X-Capital Analytics
Hello there!, Erick as I, me, that is, strongly encourage everyone to embrace data analytics in our business operations in today's data-driven world. I believe that harnessing the power of data not only enhances decision-making but also drives innovation and efficiency, leading us towards greater success!